HTTP(S) Proxy Latency Tester v0.1
Part of Proxy Report Suite.
A high-precision HTTP(S) proxy latency measurement tool written in Node.js.
Inspired by fast.com and httping, it measures time-to-first-byte (TTFB) across multiple HTTP pings via proxies, with a focus on low latency and high accuracy.
- Uses nanosecond timing via
process.hrtime.bigint() - Disables Nagle's algorithm (
TCP_NODELAY) for minimal delay - Supports HTTP(S) proxies with authentication
- Measures unloaded latency (like fast.com)
- Supports connection reuse (keep-alive) for accurate steady-state latency
- Targets IP addresses directly to avoid DNS overhead
🚀 Installation
-
Clone the repository:
git clone https://github.com/proxyreport/pingwithproxy.git
cd pingwithproxy -
Install dependencies:
npm install
Requires Node.js 18+.
For best results, Node.js 20+ is recommended.
⚙️ Configuration
Edit the ping.js file to configure:
const target = 'http://130.136.1.142'; // Target IP (avoid DNS)
const rounds = 10; // Number of pings
const concurrency = 5; // Parallel requests
- Proxy: Supports HTTP(S) proxies with or without authentication.
- Target: Use IP addresses (e.g., Google's
216.58.212.238) to skip DNS lookups. - Rounds: Total number of pings.
- Concurrency: Number of parallel pings (default: 1).
🏃 Usage
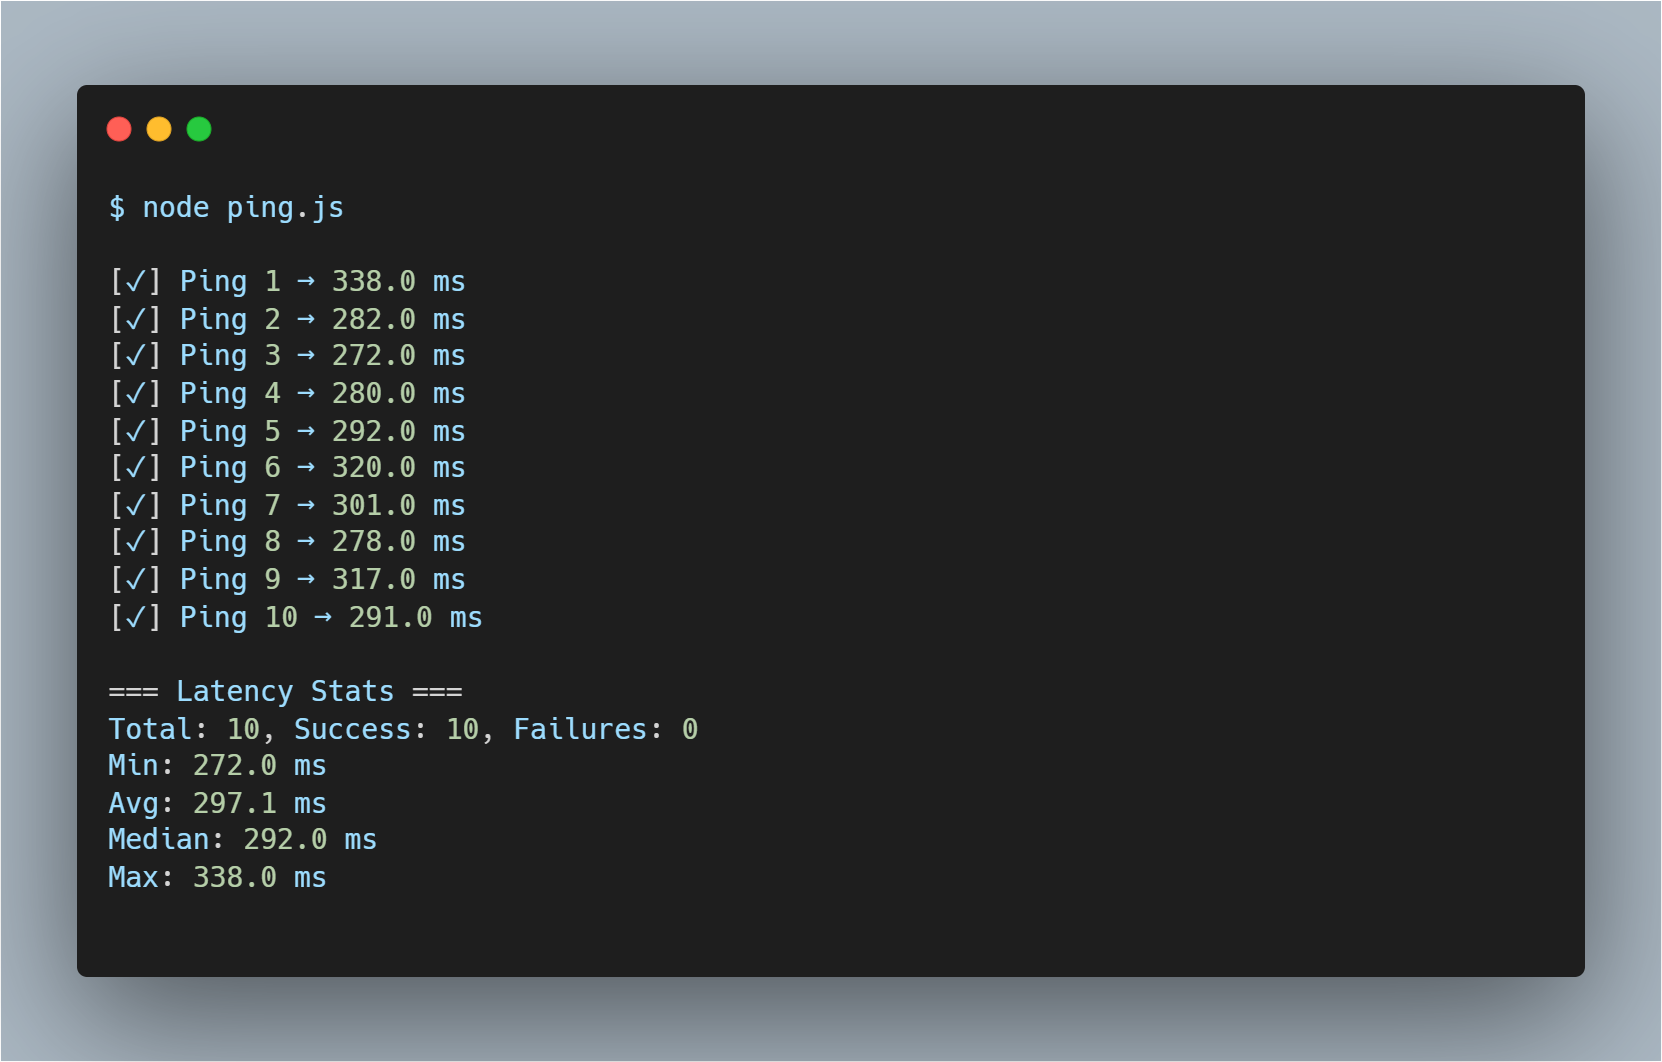
Run the latency tester:
Example output:
[✓] Ping 2 → 147.0 ms
...
=== Latency Stats ===
Total: 15, Success: 15, Failures: 0
Min: 145.0 ms
Avg: 150.3 ms
Median: 149.0 ms
Max: 158.0 ms
🛠️ Features
- Precise latency measurement: Uses time-to-first-byte (TTFB) for accurate results.
- High-resolution timers: Nanosecond accuracy with
process.hrtime.bigint(). - TCP optimizations: Disables Nagle's algorithm (
TCP_NODELAY) to reduce packet delay. - Connection reuse: Uses keep-alive for steady-state latency measurements.
- Parallel execution: Configurable concurrency for faster tests.
🤝 Contributing
Contributions are welcome!
Feel free to submit issues, feature requests, or pull requests.
Advanced Strategies for Measuring HTTP Proxy Latency
Understanding Unloaded vs. Loaded Latency
Traditional latency tests often measure a single round-trip time (e.g. via a simple HTTP HEAD request). However, real-world performance can differ when the network is under load. Unloaded latency refers to round-trip time with no other traffic, while loaded latency measures round-trip time under heavy network usage. The difference (sometimes called bufferbloat) reflects how much extra delay is introduced by network congestion. In the context of HTTP proxies, measuring both gives insight into how a proxy performs under normal conditions versus saturated conditions.
Why basic HEAD timing is insufficient: A single request might not represent typical client behavior. It may include one-time setup costs (DNS lookup, TCP and TLS handshakes) and doesn't show how the proxy handles concurrent traffic. To mimic real-world client traffic, we need to gather multiple samples and introduce parallelism to simulate load.
Multi-Stream Latency Measurements
Rather than relying on one request, send multiple small HTTP requests through the proxy and collect their response times. For example, services like Cloudflare's and Netflix's speed tests send many small GET requests (with minimal payload) to measure latency more reliably. Fast.com's client issues a batch of latency requests and computes a median latency as the result. Using the median (50th percentile) helps filter out outliers caused by jitter.
Simulating Loaded Latency Under Traffic
To measure loaded latency (latency under stress), generate traffic in parallel with the latency probes. Netflix's Fast.com and Cloudflare's speed test both perform latency checks while the connection is busy to see how congestion affects responsiveness. Essentially, you saturate the proxy connection with data and simultaneously measure latency.
Measuring TCP-Level Handshake Time
To delve deeper, you can measure TCP-level responsiveness through the proxy. This involves timing the connection setup phases (TCP and TLS handshakes) which contribute to latency but are usually hidden in a single HTTP request measurement.
Node.js Tools and Libraries for Implementation
Implementing these strategies in Node.js is facilitated by a few libraries and patterns such as HTTP(S) Proxy Agents like https-proxy-agent or http-proxy-agent. These agents plug into Node's request options and handle the CONNECT tunneling for HTTPS.
Summary
By combining multiple sample measurements, parallel traffic simulation, and low-level timing, you can closely mimic how a real client experiences latency through an HTTP(S) proxy. Instead of a simplistic single ping, this approach measures both unloaded latency and loaded latency (bufferbloat), much like fast.com and other modern speed tests. It uses multi-stream concurrency to create realistic load, as Netflix's fast.com does to saturate links for testing.
Minimizing HTTP Ping Latency: Insights from httping and Node.js Strategies
How httping Achieves Low HTTP Ping Latency
The open-source httping tool (written in Go) is designed to measure HTTP(S) round-trip times (RTT) with minimal overhead. It employs several techniques to ensure latency measurements are as low and precise as possible:
-
High-Precision Timing:
httpinguses Go's high-resolution monotonic clock to measure RTT with sub-millisecond precision. By capturing the timestamp immediately before sending the request and immediately after the response is received, it obtains an accurate measurement of the request's round-trip time. - Minimal HTTP Request Overhead: The tool restricts HTTP methods to GET or HEAD only, favoring HEAD when possible to avoid downloading a response body. This means each "ping" carries minimal payload and the server's response is small (often just headers), reducing transfer time.
-
Direct Socket/Transport Control: Instead of using a high-level abstraction that might add overhead,
httpingconfigures a custom HTTP transport for each request. For example, it explicitly enables HTTP/2 usage and adjusts TLS settings for speed. -
Proxy Handling: For measuring through proxies,
httpingintegrates proxy support at the transport level. It looks up the system proxy settings and, if a proxy is configured, attaches it to the HTTP transport before the request.
Enhancements for a Node.js HTTP Proxy Latency Tester
To bring similar "absolute lowest, most precise" latency measurements to a Node.js-based HTTP proxy latency tester, consider the following enhancements:
-
Use High-Resolution Timing APIs: Replace any usage of
Date.now()with Node's high-precision timers such asprocess.hrtime.bigint()andperformance.now()for sub-millisecond timing precision. -
Disable Nagle's Algorithm: Ensure that the TCP sockets used by your HTTP requests are not buffering small packets by using
request.setNoDelay(true)on the client request to force the network stack to send out HTTP requests immediately. -
Reuse Connections with Keep-Alive: If measuring minimal latency for repeated requests through the same proxy, leverage HTTP keep-alive using an
http.AgentwithkeepAlive: trueto avoid TCP/TLS handshake overhead on subsequent requests. - Streamline the HTTP Request: Use the simplest possible request that yields a response, such as HEAD or a lightweight GET to a known small resource through the proxy with minimal headers.